Chapter 6 — Visualising the lifecycle
This chapter draws the lifecycle of the contract with cadl-explorer and reads the diagram (about 15 minutes). In the exercises you compare the specification before and after adding the norms, and build a page that shows violations on a timeline.
6.1 What you'll learn
In the procedure:
- How to read the Contract Lifecycle page of cadl-explorer (this textbook calls what it shows the Lifecycle View).
- How visual conventions (double circle, dashed border, red edge) map to the spec.
In the exercises:
- Explain the visual conventions to an audience that does not know CADL.
- Compare two specs (v1 vs v2) using diagrams.
6.2 Background
Reading the Lifecycle View
Software engineers debug code. SoS engineers debug diagrams — because the system is too distributed to step through with a debugger. The Lifecycle View is your debugger.
| Visual element | What it means |
|---|---|
| Double circle | lifecycle.initial |
| Dashed box, green fill | terminal state Completed |
| Dashed box, red fill | terminal state Violated |
| Dashed box, grey fill | other terminal states (e.g., Terminated, Cancelled) |
Solid edge with Δ 5s | transition with a deadline |
| Red dashed edge | the forced move to the on_violation target state |
6.3 Procedure
Install into the virtual environment you activated in Chapter 2 (cadl_repo/.venv); requirements.txt asks for the same cadl-lang package that Chapter 2 installed from the clone, so nothing is replaced.
cd ~/program/cadl-explorer
pip install -r requirements.txt
streamlit run app.py
# Browser opens at http://localhost:8501
In the list of pages at the top of the sidebar, switch from the default page (Explorer) to Contract Lifecycle. (Before v0.4.0 the page was called SoS DSL Lifecycle. If the sidebar has neither, your checkout of cadl-explorer is out of date; run git pull on main.)
Two ways to load IR JSON:
- (a) Upload the IR of your own file. Save it first with
cadl sim-ir my_delivery.cadl --format json > my_delivery.ir.json(run in~/program/cadl_repo), then drag-and-dropmy_delivery.ir.jsoninto the file uploader. - (b) Use the bundled example
sos_dsl_robot_delivery.ir.json. It is shown as soon as the page opens; the dropdown (Bundled example) is there to return to it after an upload has been removed.
Shortcut. The Designer page draws the same diagram straight from a
.cadlfile, without thecadl sim-irstep: open the file under Open an existing CADL file and switch the view to Lifecycle. It can also step through one contract instance. This step uses the IR on purpose, because the IR is what the simulator and the generated runtime read.
6.4 What you should see
The screenshot below shows the page with (b), the bundled example: the sidebar with the uploader and the example selector on the left, the lifecycle diagram in the middle, and the lifecycle metadata on the right.
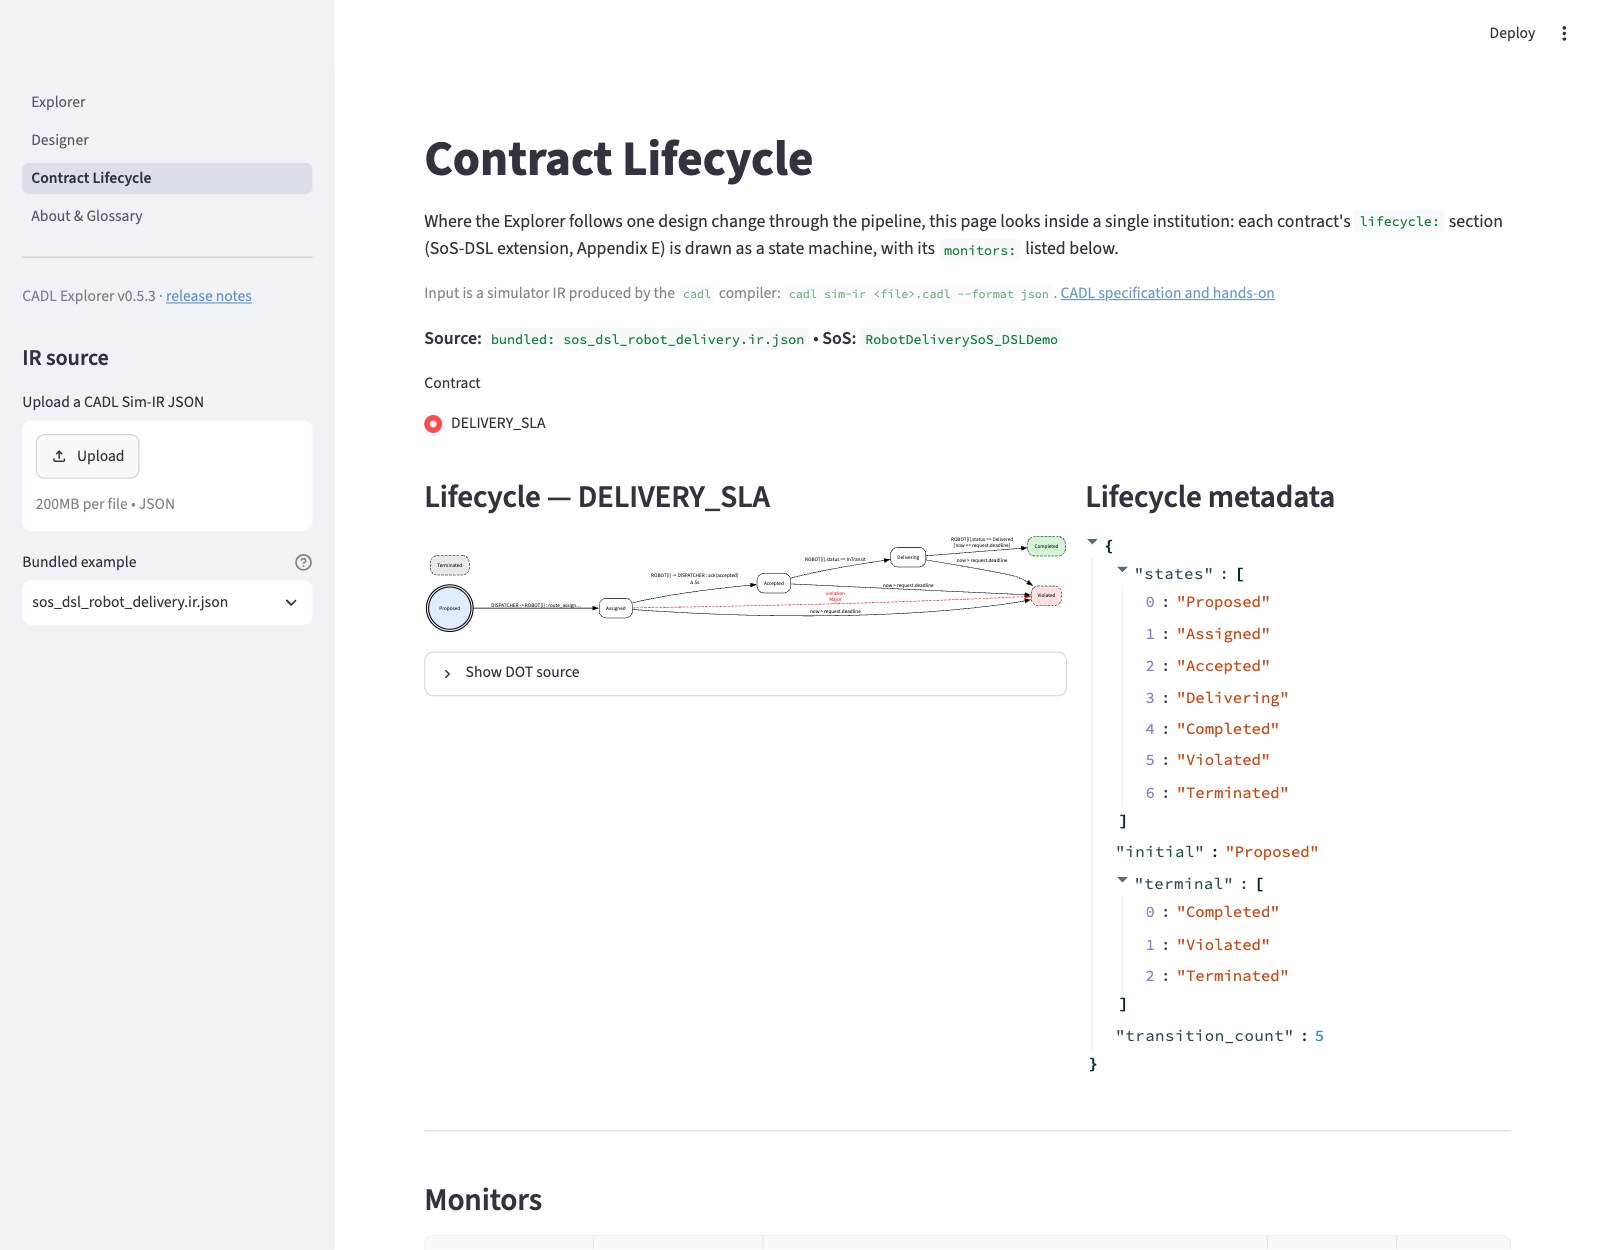
The diagram itself, enlarged (bundled example: 5 transitions; the red dashed edge is the forced move to Violated when the accept deadline expires):

Below the diagram, the page lists the monitors of the contract:
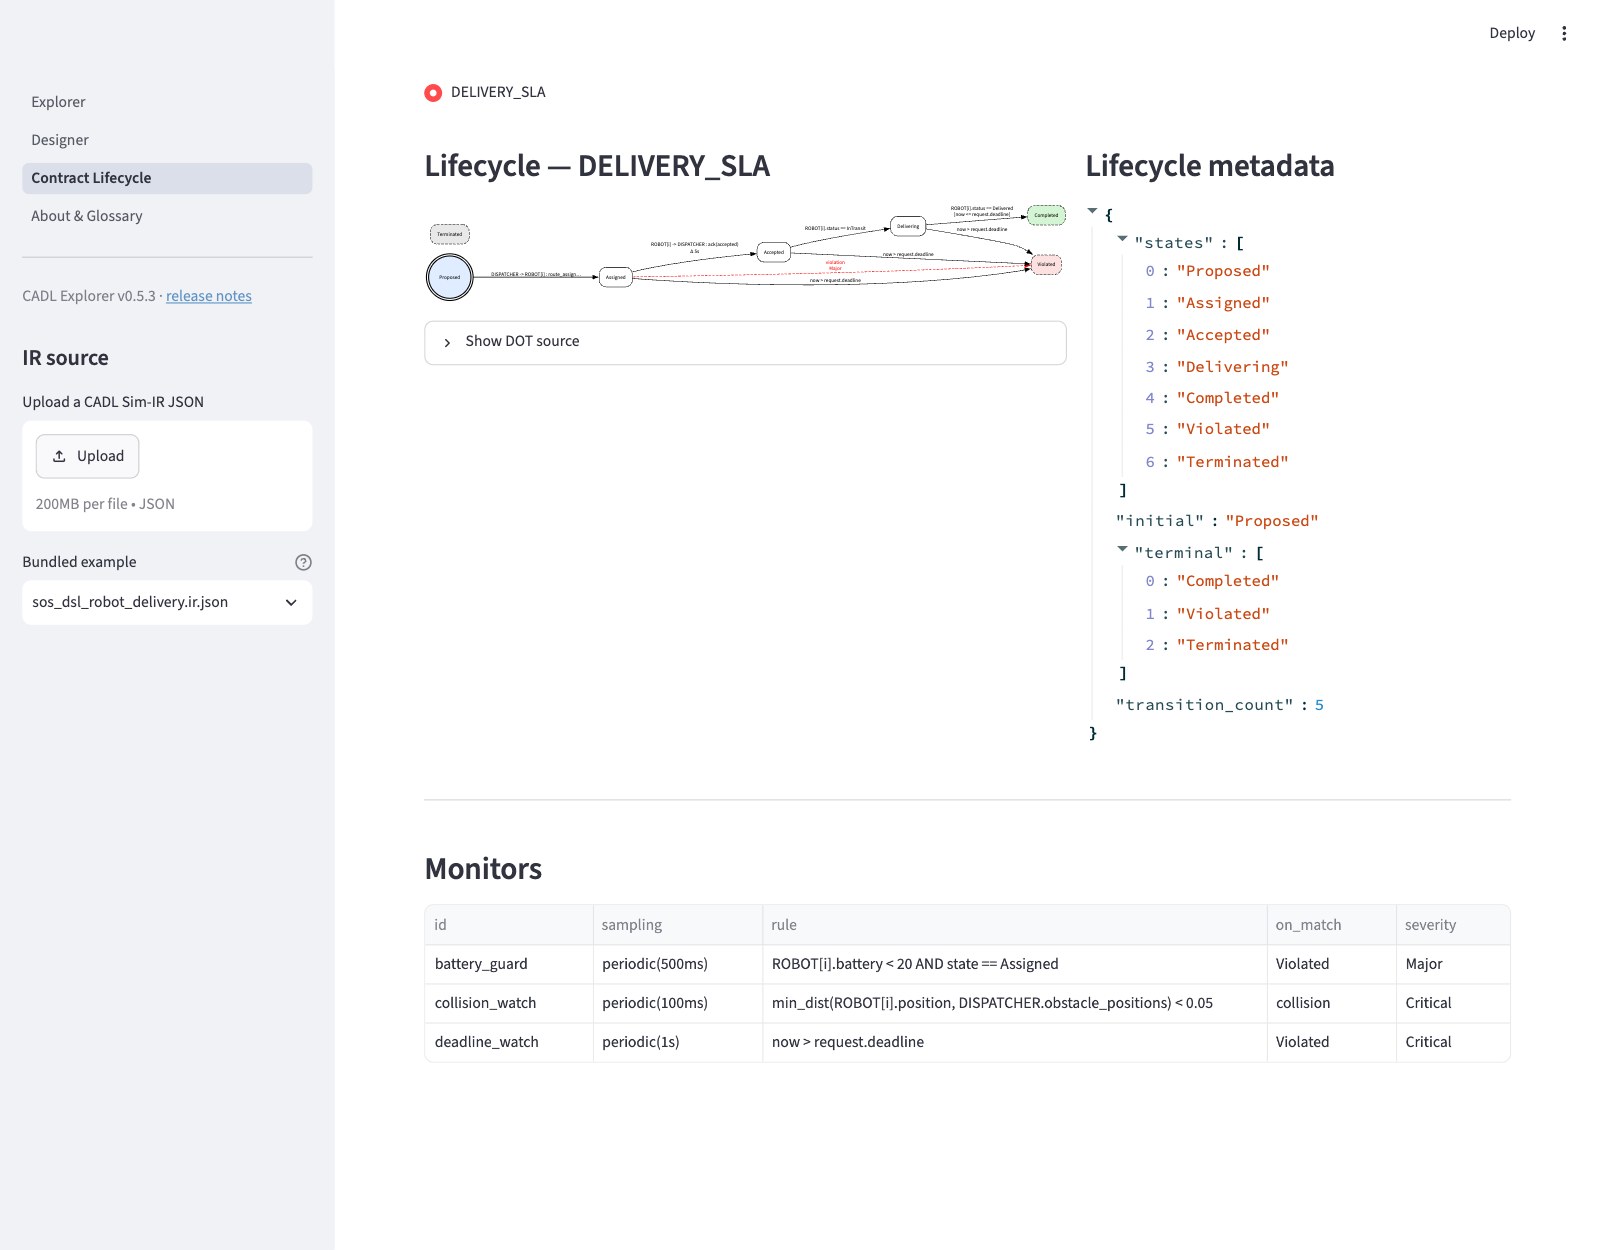
The sketch below reflects (a), my_delivery.cadl (4 transitions, 1 monitor). If you instead load (b), the bundled example sos_dsl_robot_delivery.cadl, you'll see 5 transitions (it adds late_failure) and 3 monitors (battery_guard / collision_watch / deadline_watch).
The page is split into two columns. The sketch is schematic: on the real page the diagram runs left to right, each edge is labelled with its trigger (the on: text, such as ROBOT[i] -> DISPATCHER : ack(accepted), then Δ 5s and any [when] condition) rather than the transition id, the metadata lists the state names, and the Monitors table also has a rule column.
┌──────────────────────────────────┬──────────────────────────────┐
│ Lifecycle — DELIVERY_SLA          │  Lifecycle metadata          │
│                                   │                               │
│   ┏━━━━━━━━━━┓                    │  states          : 7         │
│   ┃ Proposed ┃ ←initial(double)   │  initial         : Proposed  │
│   ┗━━━━┳━━━━━┛                    │  terminal        : 3         │
│        │ assign                   │  transition_count: 4         │
│        ▼                          │                               │
│   ┌──Assigned──┐                  │                               │
│   │            │ accept Δ 5s      │                               │
│   │            ▼                  │                               │
│   │       ┌Accepted┐              │                               │
│   │       └────┬───┘              │                               │
│   │ violation  │                  │                               │
│   │  (red dash)│ start_delivery   │                               │
│   ▼            ▼                  │                               │
│ ╔Violated╗ ┌Delivering┐           │                               │
│ ╚════════╝ └────┬─────┘           │                               │
│ (red, dashed)   │ complete         │                               │
│                 ▼                  │                               │
│             ╔Completed╗            │                               │
│             ╚═════════╝            │                               │
│             (green, dashed)        │                               │
└──────────────────────────────────┴──────────────────────────────┘

┌─────────────────────────────────────────────────────────────────┐
│ Monitors                                                          │
├──────────────┬──────────────────────┬─────────────┬──────────────┤
│ id           │ sampling             │ on_match    │ severity     │
├──────────────┼──────────────────────┼─────────────┼──────────────┤
│ battery_guard│ periodic(500ms)      │ Violated    │ Major        │
└──────────────┴──────────────────────┴─────────────┴──────────────┘
Visual conventions:
| Element | Meaning |
|---|---|
| Double circle | lifecycle.initial |
| Dashed box, green fill | terminal state Completed |
| Dashed box, red fill | terminal state Violated |
| Dashed box, grey fill | terminal state Terminated |
Solid edge, label Δ 5s | transition with deadline_ms = 5000 |
Red dashed edge with label violation Major | the forced move to the on_violation target state |
6.5 Check
Take a screenshot of your lifecycle (or just look carefully) and confirm:
- The only double-circle node is
Proposed. - There is exactly one red dashed edge going from
AssignedtoViolated. That is the forced move toViolatedwhen theacceptdeadline expires. (The bundled example also draws three solidnow > request.deadlineedges intoViolated, one for each state thelate_failuretransition can leave.) - The monitors table shows
battery_guardwith samplingperiodic(500ms)and severityMajor.
6.6 Recap
The diagram is generated directly from the IR JSON with zero hand-coding. If you change deadline: 5s to deadline: 10s in your CADL file, regenerate the IR, refresh the page — the edge label will read Δ 10s.
6.7 Exercises
Exercise 6.1 (★) — Visualise both v1 and v2
Goal: Open cadl-explorer and load both v1 and v2 IR files. Identify exactly what the Lifecycle View shows for v1 vs v2.
Procedure:
- Run
cadl-explorer(streamlit run app.py). - Generate IR for v1 too:
cadl sim-ir my_delivery_v1.cadl --format json > my_delivery_v1.ir.json. - Open the Contract Lifecycle page (in the list of pages at the top of the sidebar). Upload v1 first, then v2.
- Take screenshots.
Check: For v1, the page should display a warning that the contract has no lifecycle. For v2, it should render a state machine with 8 states (7 if you skipped Exercise 5.3, which adds Cancelled).
Exercise 6.2 (★★) — A/B comparison report
Goal: Write a 1-page A/B comparison report: the same contract, before and after Chapter 5's normative additions.
Procedure: A 1-page Markdown document, with:
- A screenshot of the v1 visualisation (likely "no lifecycle" message).
- A screenshot of the v2 lifecycle.
- A table listing: number of states, transitions with deadlines, monitors, terminal states.
- 3 sentences on what kinds of failures the v2 spec catches that v1 silently allows.
Submit: session3_comparison.md + the two screenshots.
Exercise 6.3 (★★★) — Build a Violation Trace View
Goal: Add a new Streamlit page to cadl-explorer that ingests an NDJSON log produced by multi_robot_demo --log <path> (you'll have one in Chapter 7) and displays it as a Gantt-style timeline.
Procedure:
-
Produce a log to develop against (from the simulator repository):
cd ~/program/cadl-raspimouse-simulatorpython3 -m cadl.runtime.multi_robot_demo --log session4_baseline.ndjsonEach line is one JSON record. The fields you need are
instance_id,kind(lifecycleorviolation),to_state,t_ms, and, on violations,detected_by. -
Create
cadl-explorer/cadl_sim/sos_dsl/violation_trace_view.py. Parse each NDJSON line and group byinstance_id. A state segment runs from onelifecyclerecord'st_msto the next one of the same instance. The log has no end-of-run record, so close each instance's last state at the largestt_msin the log (otherwise an instance that never leavesProposedhas no bar). -
Draw with Plotly — no new dependency required:
go.Bar(orientation="h", base=start, x=duration)for the state segments andgo.Scatter(mode="markers", marker=dict(symbol="x", color="red"))for the violations (Baralone cannot draw the markers). -
Wire it in as a page. cadl-explorer has no
pages/directory: pages live inviews/and are registered explicitly inapp.py. Createcadl-explorer/views/violation_trace.py(useviews/lifecycle.pyas a model), let it read the log withst.file_uploader(..., type=["ndjson"])(the repository bundles no sample log), then add one entry to thest.navigation([...])list inapp.py:st.Page("views/violation_trace.py", title="Violation Trace", url_path="violation-trace"),
With the baseline log you should get five rows, robot-0-1 to robot-4-1, and three red markers.
This builds on what you would expect to see in advance — by the time Chapter 7 runs simulation, you'll have a viewer ready for its output.
Using this chapter in a class
Before the session.
my_delivery_v2.cadlfrom Chapter 5.my_delivery_v2.ir.json.- (Optional) Sections 6.1–6.6 if you have not yet opened cadl-explorer.
Wrap-up and homework.
Bring to the next session (Chapter 7):
session3_comparison.md+ 2 screenshots.- (Optional) The
violation_trace_view.pycode from 3.3.
Discussion to prep: in 1 sentence each — what would surprise you in the simulation results?